# Histogram
hist(islands)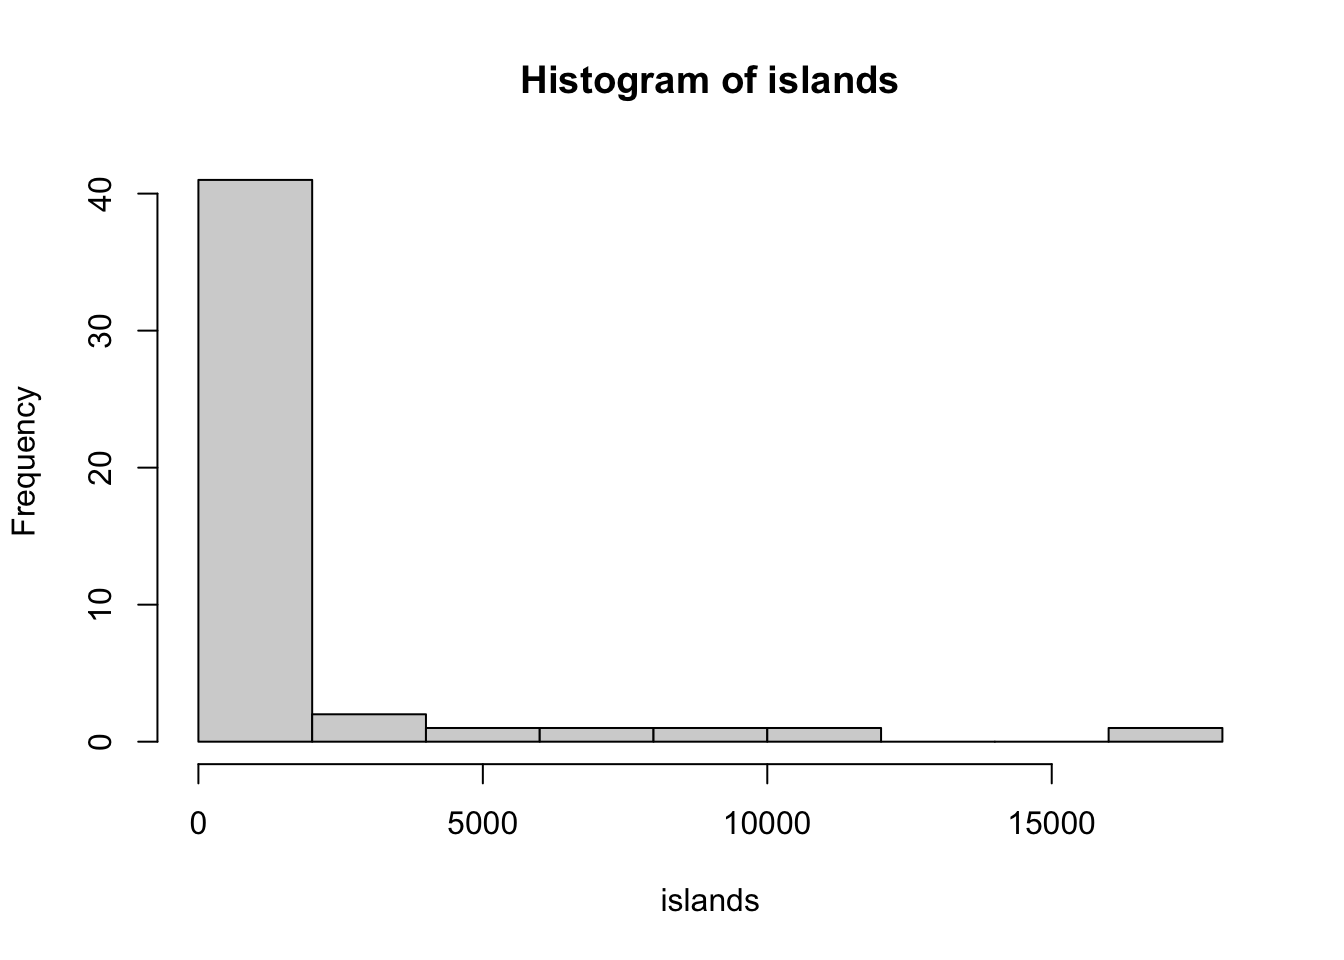

R has a number of different graphics systems. The graphics package comes when you install base R and is attached, by default, every time you start R. This package provides a lot of functionality, but it does not have a consistent syntax across different types of plots.
# Histogram
hist(islands)
# Boxplot
boxplot(islands)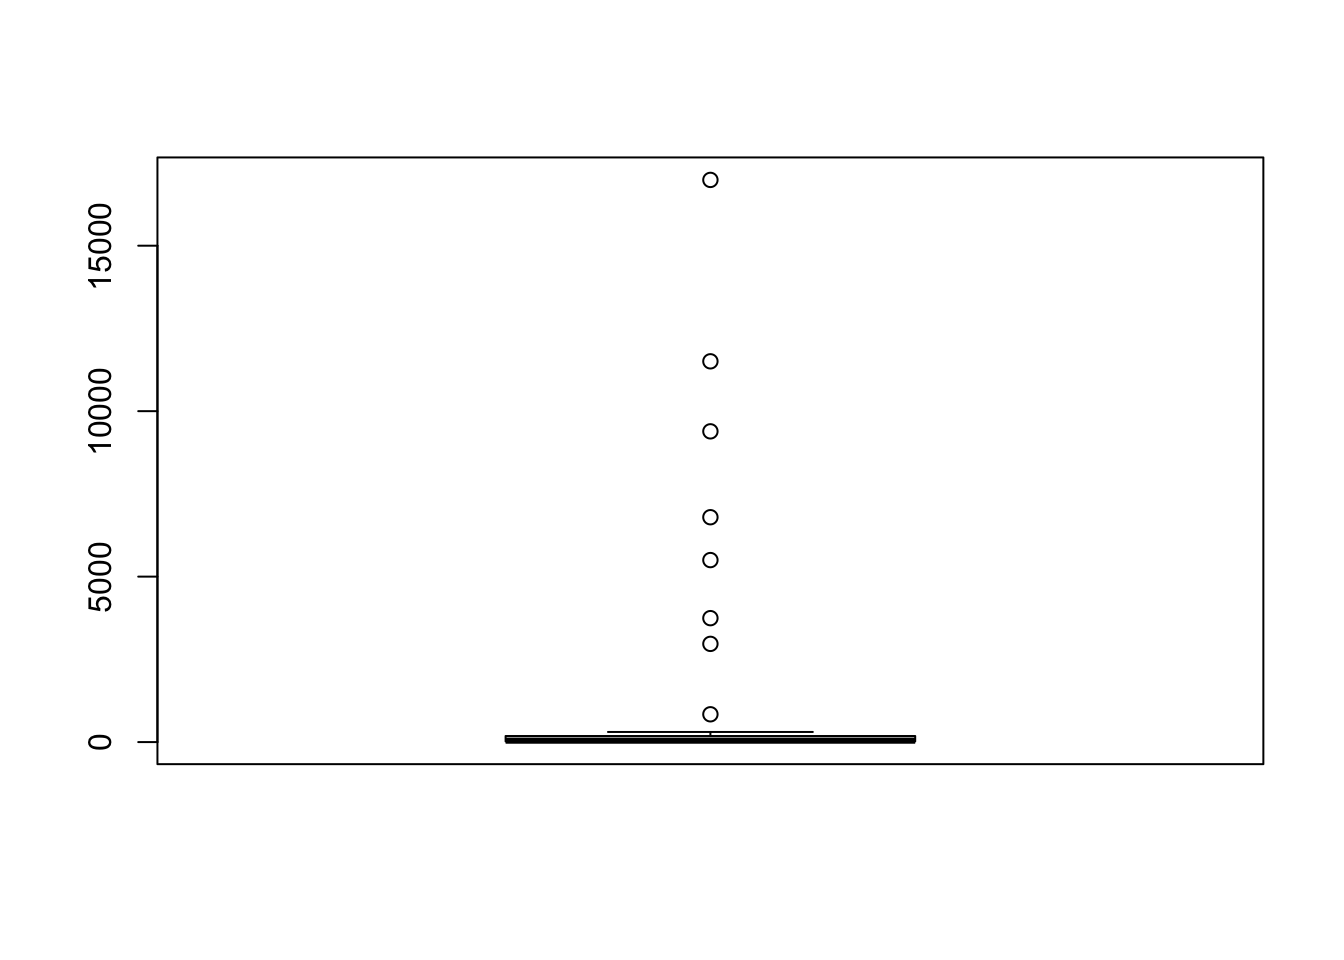
# Boxplots
boxplot(count ~ spray, data = InsectSprays)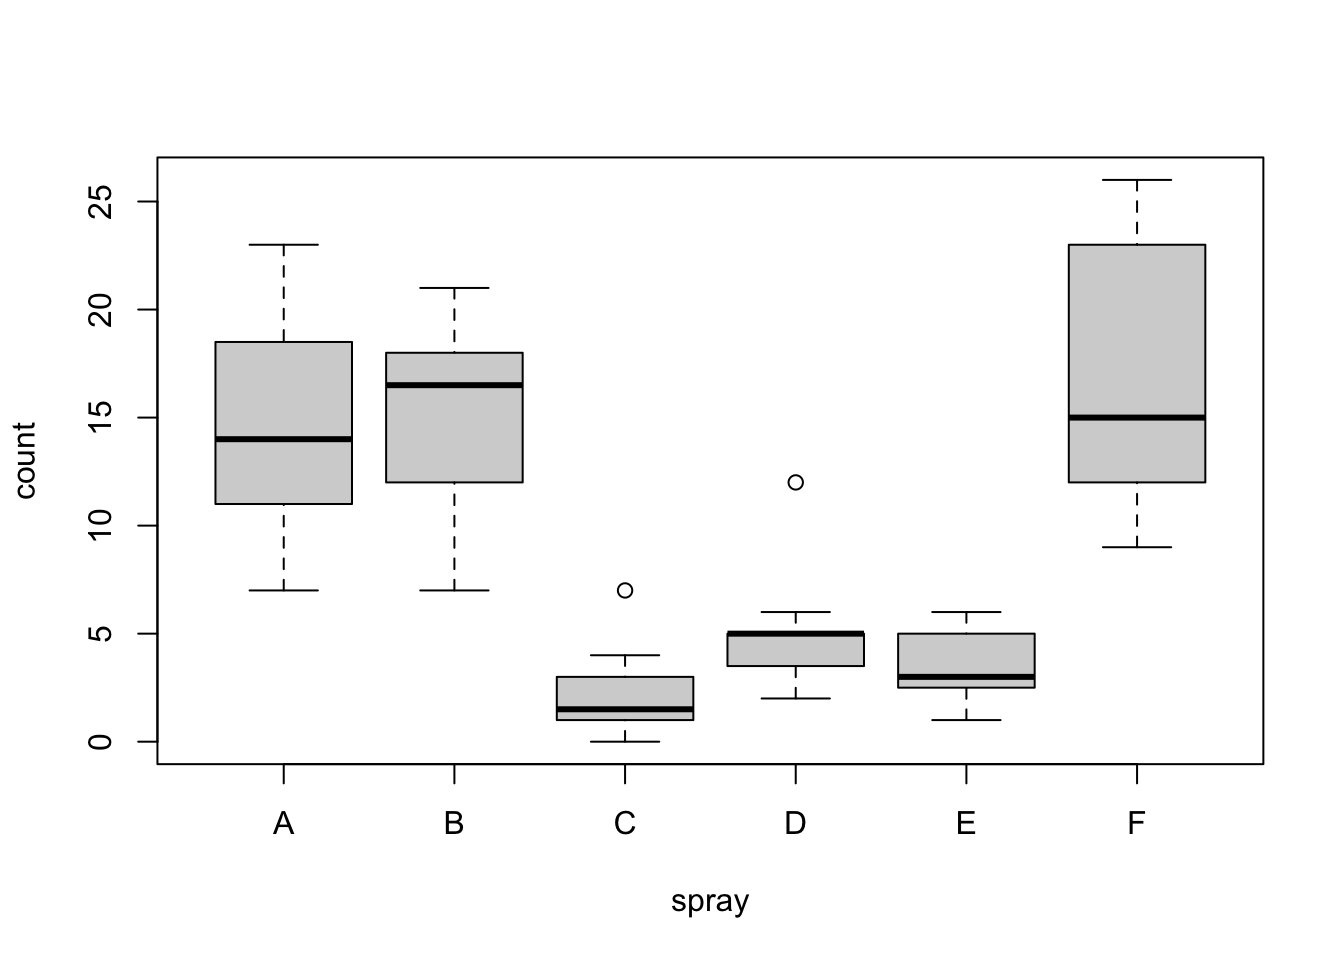
# Scatterplots
plot(x = cars$speed, y = cars$dist) # or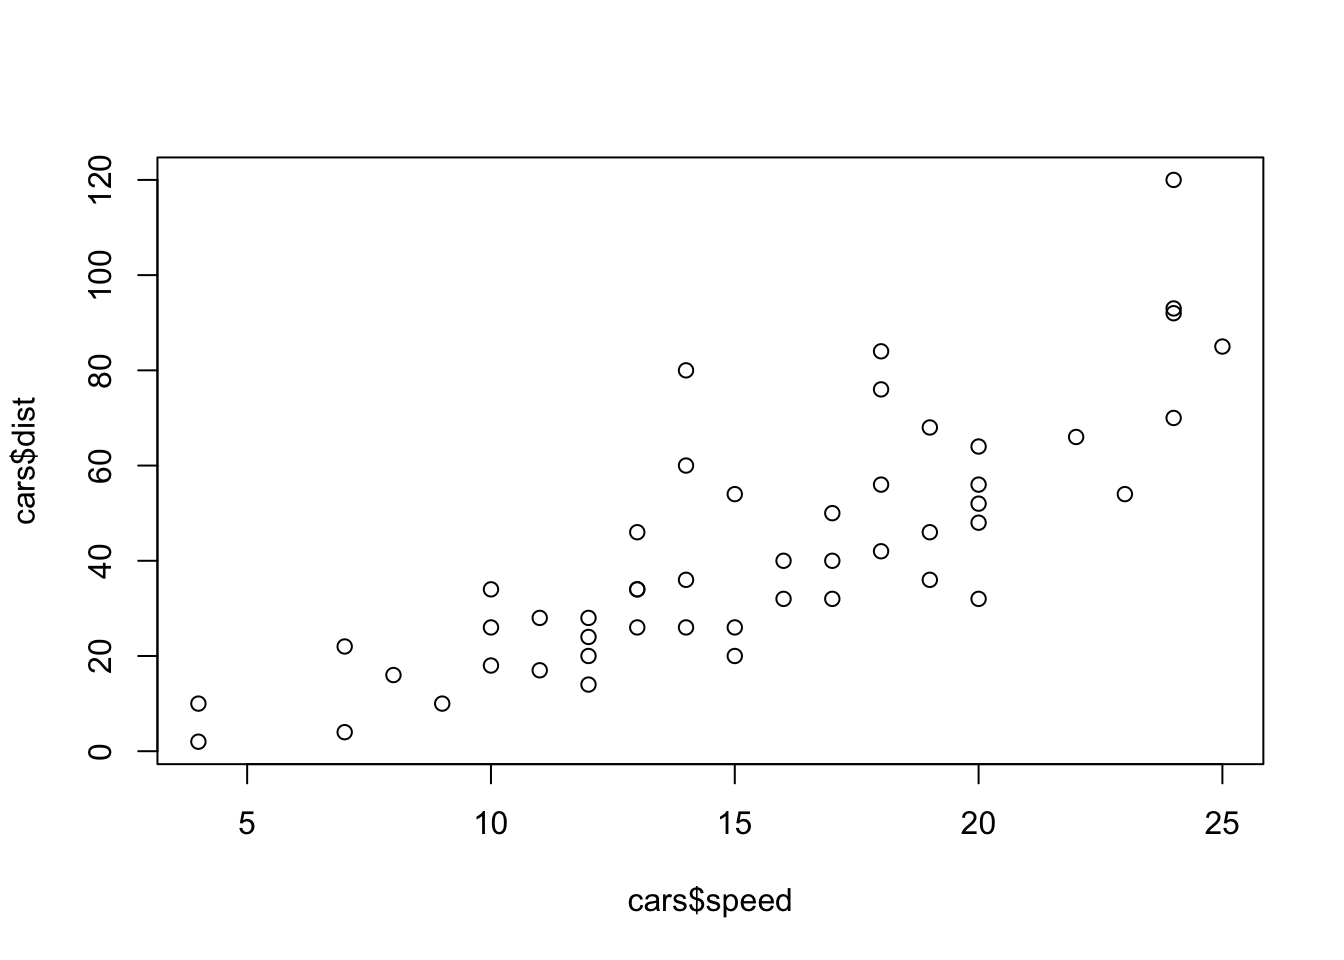
plot(dist ~ speed, data = cars) # using a formula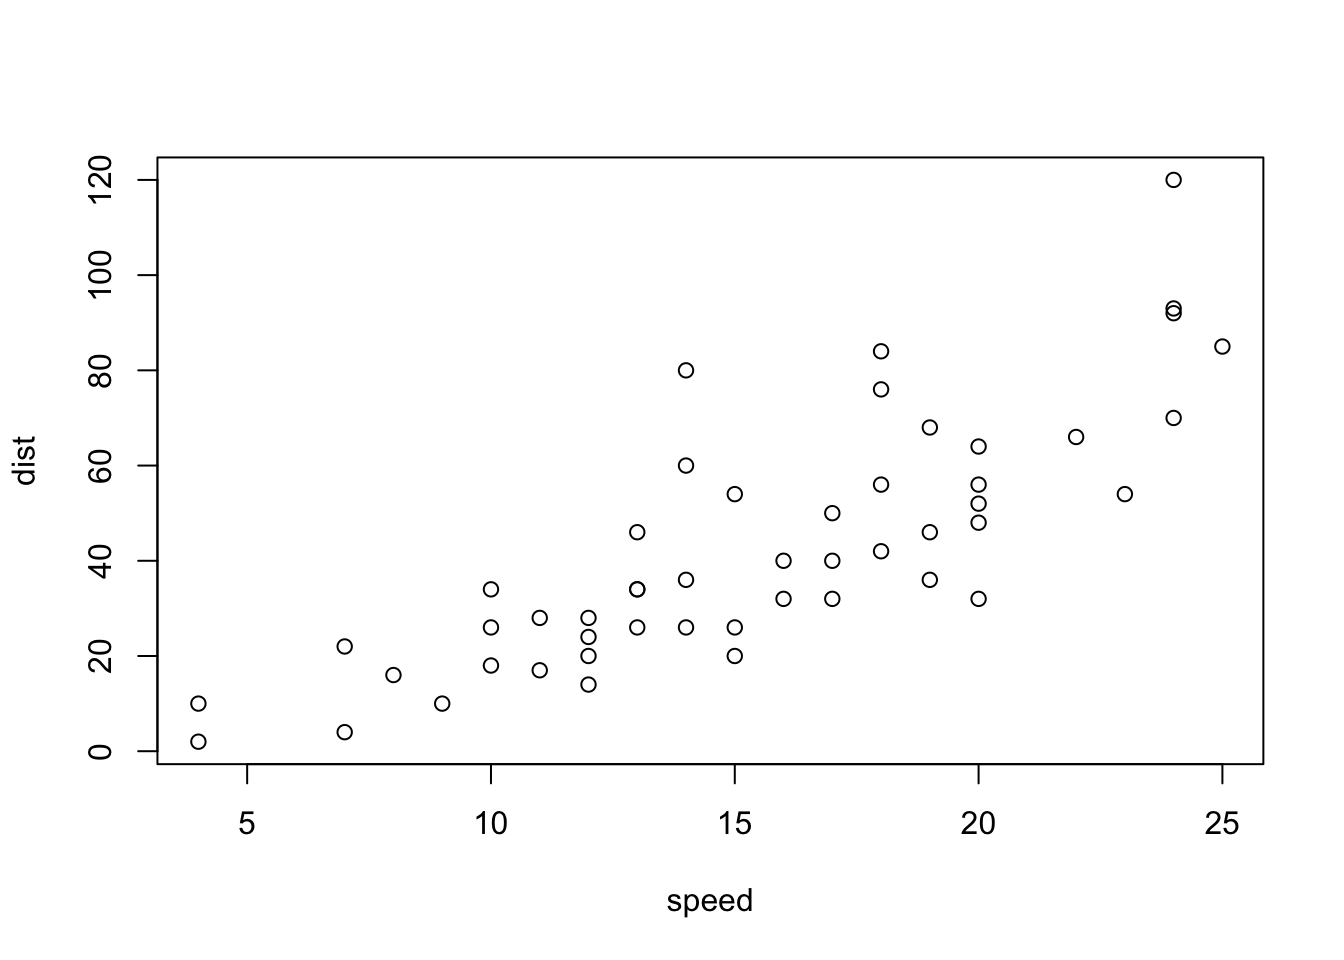
# Line plot
plot(unemploy ~ date, data = ggplot2::economics, type = "l")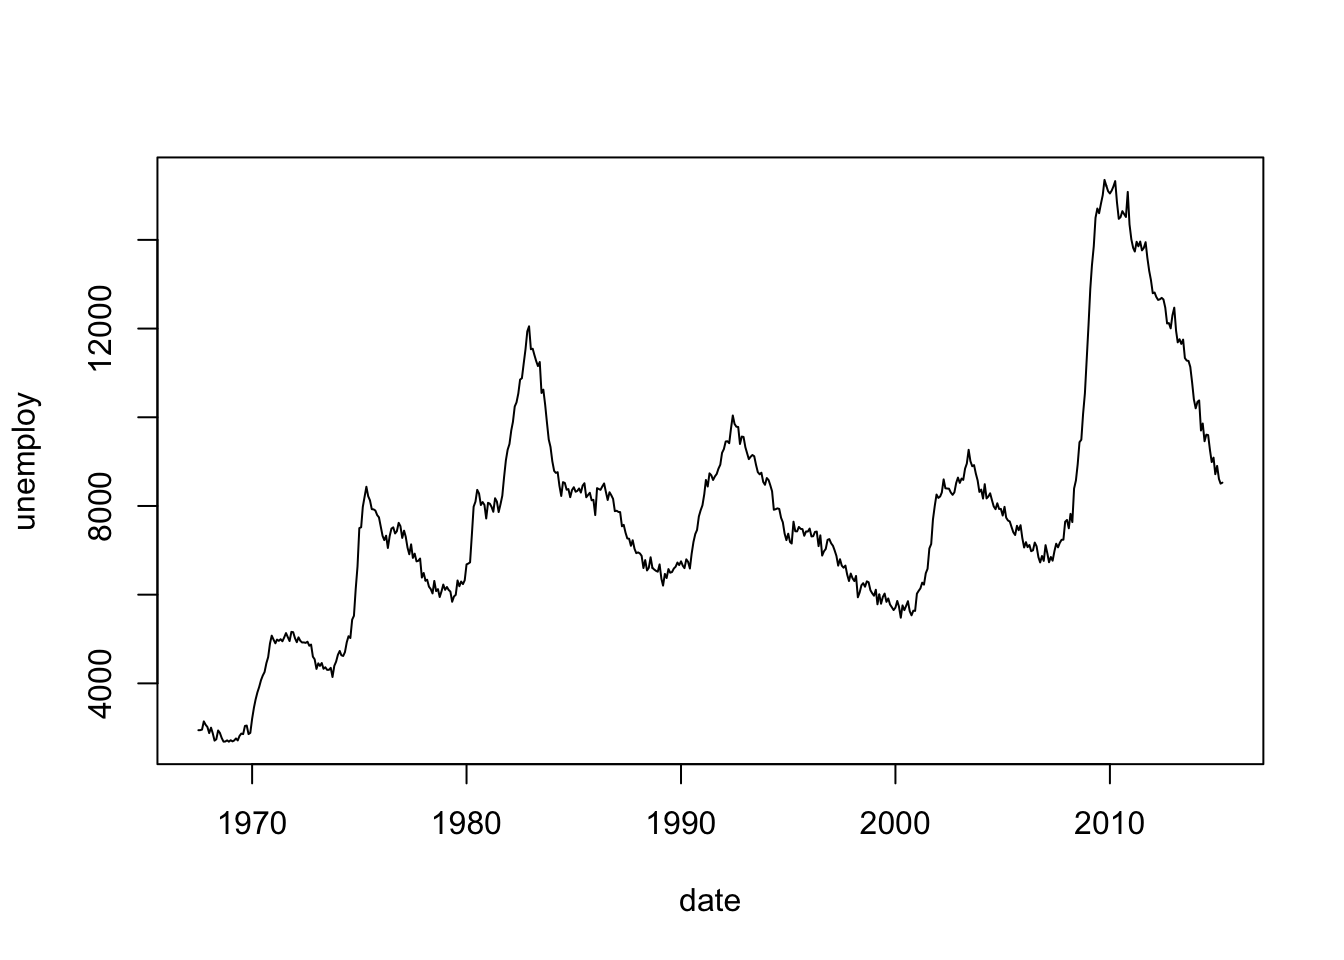
# Plot a function
curve(dnorm(x,
            mean = 3,
            sd   = 1),
      from = 0,
      to   = 6)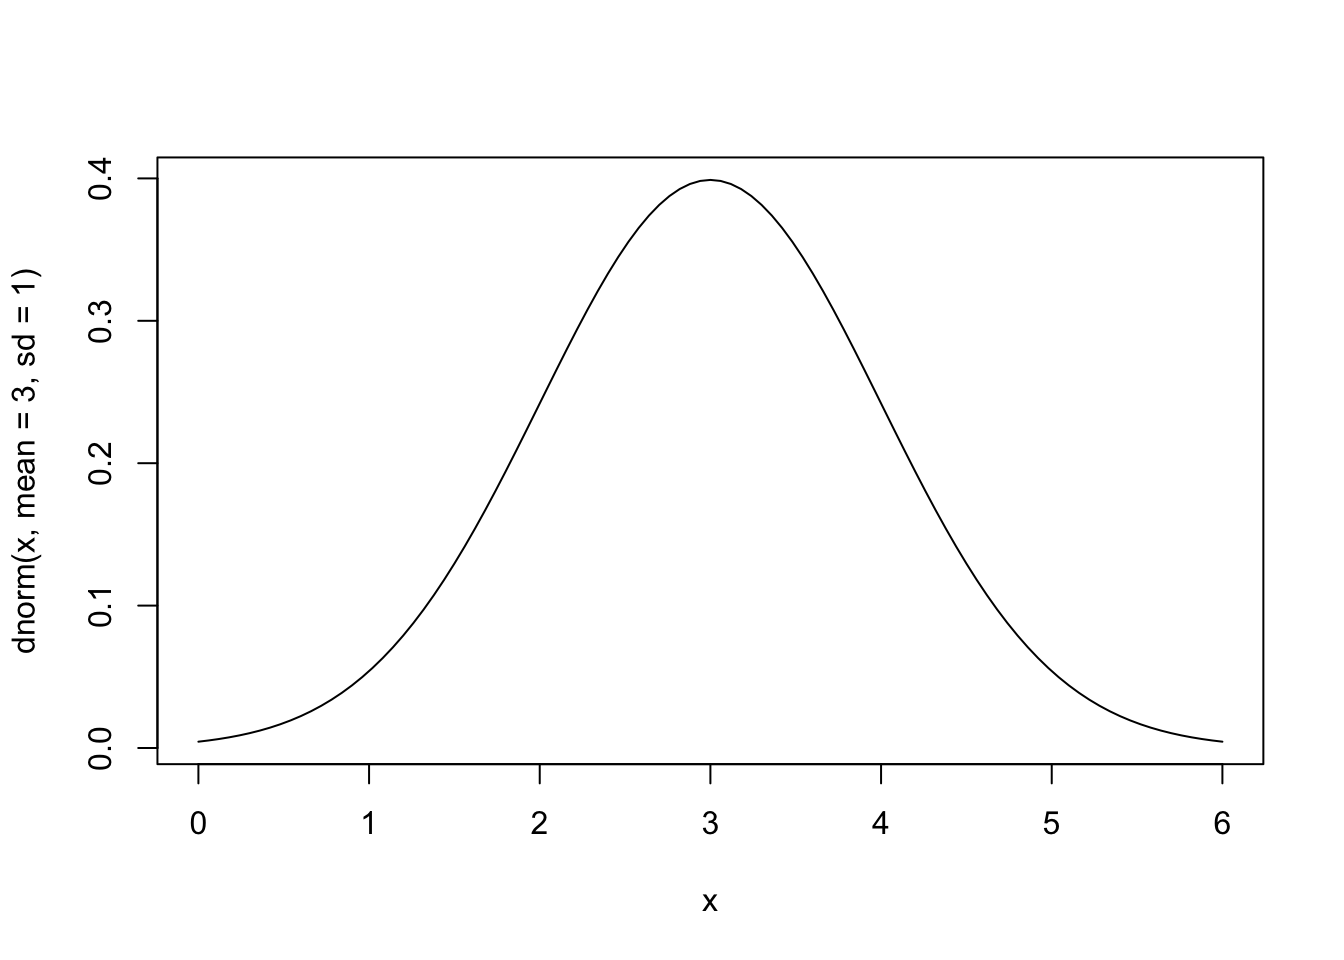
# Heatmap
image(volcano)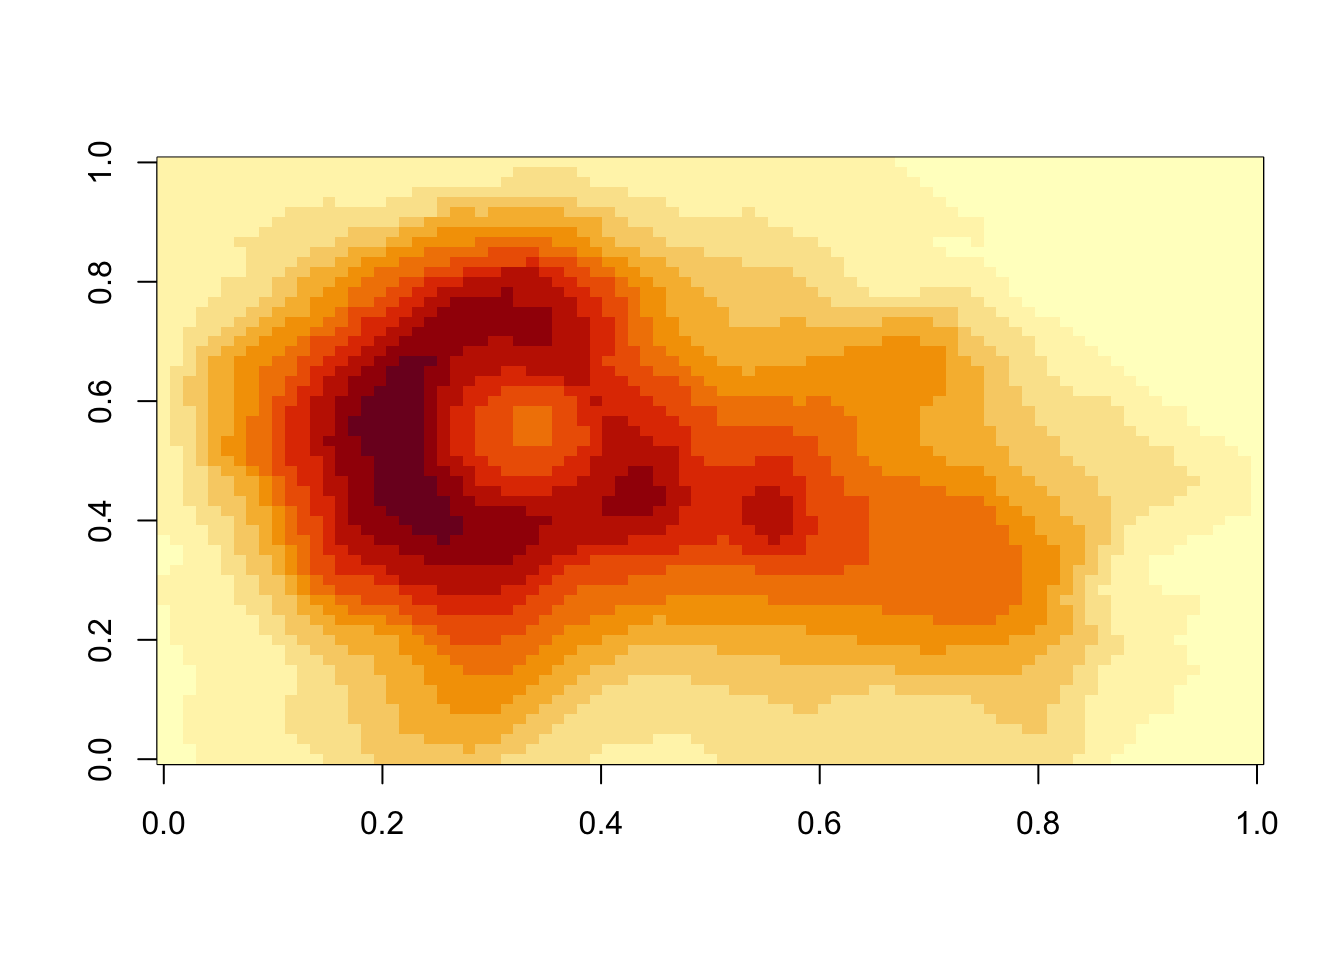
Compared to what we will see with ggplot2 graphics, base R graphics are relatively terse, i.e. the amount of code is minimal.
Using base graphics, each function uses a different data type.
# Base R graphics use all different types of data
class(islands)
[1] "numeric"class(InsectSprays)[1] "data.frame"class(cars)[1] "data.frame"class(volcano)[1] "matrix" "array"